 |
| Figure 1. Solar Flare of 18AUG12 as seen on Dopplergram |
 |
| Figure 2. Solar Flare of 18AUG12 as seen on 10 minute grabber |
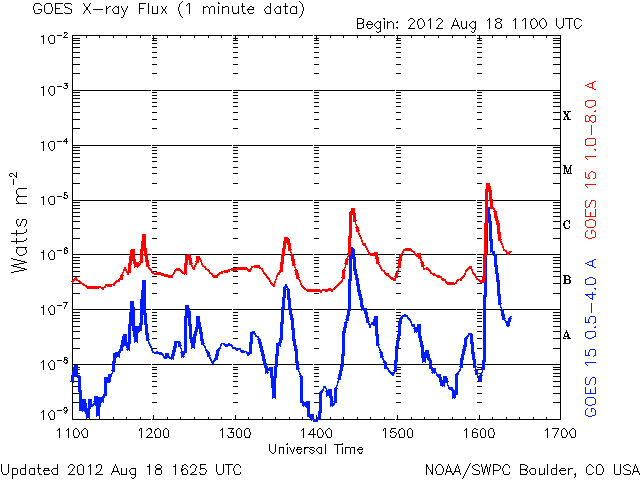 |
| Figure 3. GOES X-ray flux |
An M-class flare commenced just before 1610z. The increasing frequency means the path length was decreasing as the reflecting layer moved downward
This is the cleanest data I've recorded of a flare and justifies a calculation of Ionospheric motion from the observed Doppler shift. I assumed a simple triangle relationship of the radio path (Earth's curvature ignored) and obtained distance parameters via the Internet and the take-off angle of the signal from W6EL's propagation program. The calculations are as follows:
 |
| Figure 4. Calculations of vertical velocity of Ionosphere in response to Solar Flare of 18AUG12 |
The estimated vertical velocity of the reflecting layer was ~ 250 km/hr for a 1 Hz shift or 750 km/hr (466 mph) for the maximum 3 Hz shift as seen in Figure 2.
If we assume the average speed was 104 m/s (corresponding to an average Doppler shift of 1.5 Hz) then the distance moved by the Ionosphere over a period of 45 seconds was 4.7 km which is small compared to the starting distance, h, of 217 km. Thus h can be assumed constant.
Bottom line: the Ionosphere moved vertically downward in response to the stimulus of the Solar Flare at an average speed of 500 km/hr (310 mph).
There is a nice discussion of the Doppler effect at Wikipedia and you can check my math since I've been retired for almost 20 years now and seldom use calculus any more.

