Spectrum Lab is a creation of Wolf, DL4YHF. I can say that having delt with spectrum analysis professionally during my career as a physicist that SL is a magnificent tool. Not only does it do a nearly perfect job of rendering the waterfall spectrum but it includes an interactive programming capability which allows the user to expand the waterfall capabilities manyfold.
Lately several guys have asked for my Spectrum Lab .usr settings to help in starting to use SL. It is the King of the grabber programs but at a price...the learning curve is very steep. This is due to the many features, so many that it's hard to figure out which ones you need for grabber work except by lengthy experimentation. I've been using SL for about 10 years and still find things I didn't know plus many I do know about but haven't had time to learn to use yet.
To get you started here are the .usr files for both the 10 minute and 6 Hour grabbers, plus comments on how to change the relevant settings to customize SL for your way. Place these files in the "Configurations" folder and note their names carefully since this folder comes with many other .usr files.
After you run SL for the first time click on the "Quick Settings" tab at the top then "Load & Create User def'd entries...". Increment to Menu Nr 1 then click on "Import", find the .usr file, open it and click on Done.
Next:
1. Click on Start/Stop at the top and then "Start Sound Thread"
2. Click on "Options" then "Audio I/O" and select your sound card then the "CTRL" button to set the level so that the the noise is at the bottom of the amplitude scale on the right.
At this point your SL should work just like mine. Once everything seems to be working it's a good idea to save this configuration in the "Quick Settings" window with a slightly diff name to distinguish it from the .usr file I provided so you can come back to it in the event things get all screwed up from experimenting.
The only other things relevant to a grabber are:
1. Options: FFT, Audio I/O and Spectrum Display Settings Parts 1 and 2.
2. View/Windows: Controls on Left Side
------------------------------------------------------------------------------------------------
 |
| SL FFT Screen |
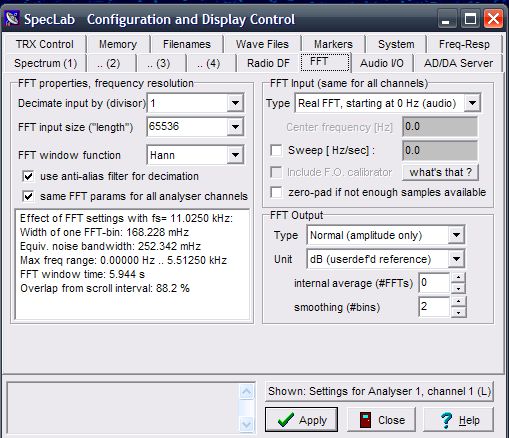
Proper use of the FFT screen requires some knowledge of FFT which can be pretty complicated. The FFT Input Size essentially determines the spectral resolution and I've found that 65536 is the max usable for a 10 minute QRSS screen. If you try a higher number for greater resolution it will be necessary to slow the scan rate down or else the image will become blurry due to longer response time. If you want to use the other stuff in a meaningful way you'll just have to bite the bullet and read up on the Fast Fourier Transform.
------------------------------------------------------------------------------------------------
On the Audio I/O screen the only other things to adjust are the sample rate and it's calibration. It is interactive with the FFT sample size and the optimum I've found is 11025. Again, you need to know FFT theory to do it in a meaningful way. Your sound card rate will differ from the 11025 and cause an error in the frequency scale on the display. This can be corrected by measuring the apparent frequency of a known frequency and entering the data into the Sample Rate Calibrator. I use the audio signal from WWV which is available for 500 and 600 Hz.
------------------------------------------------------------------------------------------------
On the Spectrum Display, Part 1 the main adjustment is the Waterfall Scroll Interval. 700 mSec is just right for a 10 minute grabber with amplitude graph and 20000 for my 6 hour grabber without amplitude graph. I've found no reason to make a screen width "exact" in terms of the desired time coverage. For example, having a 10 minute grabber go a minute or so longer works just fine even for stacking purposes. Of the little boxes to check only Vertical Freq Axis, optimum waterfall avg, Amplitude Grid and Waterfall Time Grid Enabled seem to be important. In the Show window you can select whether and where to have the amplitude grid and below that how wide to make the amplitude window. The other parameters in Waterfall Time Grid allow choice of the time ticks along the bottom.
------------------------------------------------------------------------------------------------
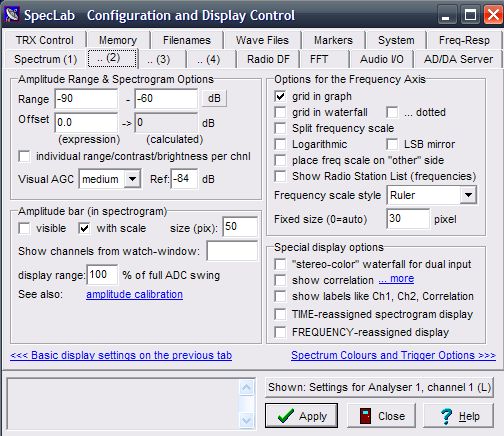
On the Spectrum Display, Part 2 the main adjustment is the range, which interacts with the signal level into the sound card. I find that a range from -90 to -30 dB is a good starting point and that the signal level should be adjusted to make the noise level at about -90 dB. The Visual AGC is an interesting function and helps keep the display at a constant level. The selections are off, slow, medium and fast plus a reference level. If it's off you may find it necessary to adjust the rx audio or sound card level often. The ref should be close to the low end of the range or about -84 dB when the lower end is -90. Selecting "fast" suppresses most impulse noise like lightning and slow or medium shows such noise. Sometimes it's good to see lightning or other clicks and pops from local switch gear but I've found that for stacking it's best to eliminate it since it accumulates in the stacked image. Whatever the choice, it's mainly an appearance thing and doesn't actually improve the SNR, etc. As for the other choices, I always select Grid in Graph to help in reading signal levels and occasionally Grid in Waterfall (dotted) to help in reading frequencies in the waterfall. Finally, use the Frequency Scale Style to select either Classic (more detailed and larger) or Ruler (less cluttered and smaller) along with the Pixel Size to select it's size.
-------------------------------------------------------------------------------------------------
Finally, on the "Controls on Left" under View/Windows you will find the adjustments for total spectral range and the colors, intensity and contrast of the display. For an offset of 0 enter the desired audio frequency range (min & max). I use 1300 Hz as the center of the QRSS band in question and go 100 Hz above and below this. Thus the Min and Max frequencies are 1200 and 1400 Hz, respectively. For example, with my TS-440 in USB mode and dial frequency of 10138.700 a signal at 10140.000 will produce an audio tone of 1300 Hz. That is, 10140.000 - 10138.700 = 1300 Hz. Enter the dial frequency (Hz) in the Offset window to make the frequency scale read in absolute units of Hz. To get the screen looking just the way you want it select a color scheme by left-clicking on the color palette then move the B slider to adjust Brightness and the C slider to adjust Contrast.
There you go. I've mentioned everything I've found important and I think you can ignore all the rest. Even so, when I look at how much I've just typed that's still a lot. But KEEP IN MIND you should be able to use the .usr files I sent without needing to advance all the way up the learning curve and/or learn it as you feel necessary or have time. Don't forget to read the Spectrum Help file for more detailed help.
de w4hbk


No comments:
Post a Comment