opening

Regular reports of my grabber activity and that of others, plus information on QRSS software, hardware and technique that comes my way

Friday, September 21, 2012

Plotting Signal Strengths with Spectrum Lab

Spectrum Lab has a feature which allows one to bracket a signal on the waterfall display and watch its signal strength as a strip chart recording.  This feature is called "Watch List & Plot Window" and is found in the "View/Windows" menu at the top of the display.  Here's the set-up screen:

Set-up screen for SpectrumLab signal plotter.

It's a bit tedious to learn to use and involves a set of commands, functions and expressions reminiscent of BASIC which allow a signal on the waterfall display to be selected and plotted.  But the good news is that only a few instructions are necessary for making a simple strip chart recorder.  I use two expressions:  noise_n(f1,f2) which plots the band noise in the range between f1 and f2 which are two audio frequencies on the WF display and peak_a(f1,f2) which yields the peak signal between two frequencies.  Up to 6 signals may be selected and plotted at the same time.

The noise_n function divides the range between the two specified frequencies into 256 bins and averages the 1/4 lowest values to obtain the band noise.  The likelihood of including actual signals in this average is very low unless there is broadband interference present such as from RTTY or JT65.

The peak_a(f1,f2) expression brackets the signal of interest, divides it into 256 bins and selects the largest value to plot.  This makes a varying QRSS fskcw signal appear as a continuous line since the mark and space are always within the brackets.  Wolf thinks of everything.

OK, so why the interest in plotting signal strength?  One reason would be to watch for changes in your signal while doing some antenna comparisons, for example.  Another and the one in which I'm interested is to study QSB.  There are three causes of QSB:  multipath interference, Faraday rotation and ionospheric focusing.  In multipath the signal is reflected from two or more layers and arrives at the rx antenna to interfere destructively and constructively.  In Faraday rotation the polarization of a linear transmitted wave rotates as it passes thru the Earth's magnetic field and arrives at the polarized rx antenna at a state other than of the tx antenna, ie a vertically polarized transmitted wave can arrive at the rx as another polarization, including eliptical.  Focusing is cause by the shape of the ionosphere which can vary from convex to concave.

Scientist and engineers who study propagation have utilized simultaneous recordings of the vertical and horizontal vectors to detect the Faraday effect and the qualitative nature of the overall variations to separate the three effects.  It ain't easy and requires sophisticated computing capability and understanding of propagation, definitely a job for professionals.  However, that doesn't keep we amateurs from having fun with the subject, making our own observations and attempting to guess which effects are occurring.

My favorite reference on QSB is the dissertation of Dr. Yau at the University of Adelaide who studied the effect on OTHR signals in the 6 to 10 MHz range.  There's a good discussion of hf propagation there plus a details of the receiving apparatus and computational techniques.  Imagine getting a PhD in QSB!

Here's an example of QSB recordings I've made on some 30m signals:

Example of strip chart recording

The Red trace is the band noise, Yellow is KD4PBJ near Chattanooga, TN and Green is AK4T near Atlanta, GA.  

de w4hbk


Wednesday, August 29, 2012

Using DropBox to Build an On-Line Grabber

Building an on-line grabber is a two step process.  First, download and learn to use a waterfall display grabber such as ARGO or SpectrumLab.  Of the two, ARGO is much simpler to use while SpectrumLab is more versatile....I have a SpectrumLab turorial on this blog to help overcome the learning curve.

Second, upload your grabs either to a web page or to the DropBox photo sharing service.  The web page approach is more versatile and sophisticated but has a steep learning curve if you don't already know how to design a web page and get in online.

That's where DropBox comes in.  All you need to do is open a FREE account which links a folder on your computer directly to one at DB.  Then as ARGO or SL makes the grabs and stores them in the computer's DB folder they magically appear in the one at DB.  Furthermore, DB is designed for image sharing and all you need do is obtain the link to the image in question and show it to the Knights so they can view it.

I've been running an auxiliary online grabber using this method and it works FB...with one exception...it will not automatically update and the user needs to click his refresh button to see the latest grab.  This is not considered objectionable according to several comments I've received.

Here are the details of the DB folders.

After setting up the *Free* DB account this is the opening screen you will see.  You are provided with two basic folders, one called Photos, which we will be using, and another called Public which is useful for other files such a programs and sound files.  Note also the Getting Started file which will explain everything.


Next open the Photos folder which will look something like this:

The only one of interest to us is 10 Minute Grabber which is where the grab ends up.  Open this one and we see,

a single file which is the actual .jpg  uploaded from the grabber and which is to be viewed by the user.  Click on the "link" icon to the right to copy the link and pass it along to your potential user.

This is the actual folder set-up at DropBox and there is a similar one on your computer at a location you specify when setting it up.  This is where you direct the grabs made by ARGO or SL.

Note that I gave the file a rather strange name..."W4HBK Grabber  (REFRESH for latest grab)".  That's so a message will show up at the top of the screen to ID my grabber and remind the user to hit the REFRESH button once in a while.

Now you must add a new line to the Periodic Actions commands:

capture("C:\Users\bill\Dropbox\Photos\10 Minute Archive\W4HBK Grabber  (REFRESH for latest grab.jpg")

Here's what the Periodic Actions screen will now look like:


Finally, go to the image file in your Dropbox folder, right-click on it and select "Copy Dropbox Link".  Open a new Tab, paste the link and make sure it opens the file.  This link is the one you send to users so they can open the file.

Note that it DOES NOT auto-update and the user will need to refresh the screen to see the latest grab.  That's why the reminder in the name, "W4HBK Grabber  (REFRESH for latest grab.jpg"

There is an easy way to make it auto-refresh and that is with a browser extension that auto-refreshes the screen at an interval you select.  I use "Easy Auto Refresh" for my Google Chrome browser.

If you publish the link to ur archive the user can also view all the grabs there.

If you have any problems please feel free to contact me at owlpoop@gmail.com


de w4hbk


Sunday, August 19, 2012

Dopplergram Catches a Solar Flare

Yesterday I took a day off from grabbing to try my new Dopplergram on the WWV 10 MHz signal.  As luck would have it an M-class Solar Flare occurred during the recording:

Figure 1.  Solar Flare of 18AUG12 as seen on Dopplergram

Figure 2.  Solar Flare of 18AUG12 as seen on 10 minute grabber


Figure 3.  GOES X-ray flux

An M-class flare commenced just before 1610z.  The increasing frequency means the path length was decreasing as the reflecting layer moved downward

This is the cleanest data I've recorded of a flare and justifies a calculation of Ionospheric motion from the observed Doppler shift.  I assumed a simple triangle relationship of the radio path (Earth's curvature ignored) and obtained distance parameters via the Internet and the take-off angle of the signal from W6EL's propagation program.  The calculations are as follows:

Figure 4.  Calculations of vertical velocity of Ionosphere in response to Solar Flare of 18AUG12

The estimated vertical velocity of the reflecting layer was ~ 250 km/hr for a 1 Hz shift or 750 km/hr (466 mph) for the maximum 3 Hz shift as seen in Figure 2.

If we assume the average speed was 104 m/s (corresponding to an average Doppler shift of 1.5 Hz) then the distance moved by the Ionosphere over a period of 45 seconds was  4.7 km which is small compared to the starting distance, h, of 217 km.  Thus h can be assumed constant.

Bottom line:  the Ionosphere moved vertically downward in response to the stimulus of the Solar Flare at an average speed of 500 km/hr (310 mph).

There is a nice discussion of the Doppler effect at Wikipedia and you can check my math since I've been retired for almost 20 years now and seldom use calculus any more.

Wednesday, August 15, 2012

cURL .. A New Command for FTP Upload

While playing with Puppy Linux I discovered a versatile command for uploading data with URL syntax.  Not only FTP uploading but a host of other things:

"curl is a command line tool for transferring data with URL syntax, supporting DICT, FILE, FTP, FTPS, Gopher, HTTP, HTTPS, IMAP, IMAPS, LDAP, LDAPS, POP3, POP3S, RTMP, RTSP, SCP, SFTP, SMTP, SMTPS, Telnet and TFTP. curl supports SSL certificates, HTTP POST, HTTP PUT, FTP uploading, HTTP form based upload, proxies, cookies, user+password authentication (Basic, Digest, NTLM, Negotiate, kerberos...), file transfer resume, proxy tunneling and a busload of other"

It was so easy and direct to use in Linux that I adopted it as my official FTP uploader.  It has been ported to Windows so I use it there also for all my grabber operations. It has so many features that there is even a web site just for this one command:  http://curl.haxx.se/  You can download cURL and it's associated files here and read the many help files on it's syntax and use.

If you are concerned just with FTP uploading there is probably no reason to use cURL instead of DOS commands but I wanted to learn it for future applications involving all those buzz words in the quoted text above.  Also, I flip back and forth between Windows and Linux and the syntax is the same in either OS.

Here's what the command line looks like in Spectrum Lab:

exec ("\SLuploader\curl -u username:password -T  \SLuploader\SL1.jpg ftp://ftp.qsl.net ")

The root folder SLuploader contains the curl command and it's associated files.  I send grabs from both of my grabbers to that folder and it sends them to the corresponding online grabber pages.

For comparison to FTP via DOS commands see my previous post Uploading Files Using DOS Commands .  As I said above, if you are happy with the DOS method there is no compelling reason to switch to cURL just for FTP uploads but I wanted to point it out because of it's many advanced features which may be useful in other applications.

de w4hbk


Sunday, July 15, 2012

CME Effect on 40m QRSS Signal

This post is to document the effect of a Coronal Mass Ejection (CME) on a QRSS signal propagating between New Mexico (WA5DJJ) and Florida (W4HBK).  The CME occurred on July 12 and was described in my last post.

Figure 1 shows the observed effect.  DJJ transmits a fsk cw signal referenced to a Rubidium frequency standard which at this time scale produces two parallel lines corresponding to the fsk mark and space.  The Master Oscillator of my TS-440 is temperature controlled, thus the observed frequency changes are due to Doppler shifts caused by motion of the ionosphere.   As luck would have it, Dave's signal came on just before the start of the disturbance while the QRM ceased at the same time.

Figure 1.  Frequency shift of WA5DJJ signal during geomagnetic disturbance

Note these features:

1.  Start time is about 0345z
2.  As the event progressed four separate layers developed as the frequency shifted downward followed by a reversal with a decaying sine wave pattern.
3.  The apparent speed of the wave was very slow with a period or 1 to 2 hours.

Figure 2 is a corresponding magnetometer recording from Anchorage, AK which indicates time history of the geomagnetic disturbance.

Figure 2.  Geomagnetic disturbance recorded at Reeve Engineering Labs in Anchorage, AK

This leaves little doubt that the observed effect on the QRSS signal was caused by the disturbance.  However, this was not the initial arrival of the CME.  As shown in Figure 3 that actually occurred the day before at 1700z.

Figure 3.  CME history recorded by ACE spacecraft (~ 1 hr before before seen at Earth)


Our observation was related to the minor hump occurring at about 0300z.  I had made an effort to be watching for the arrival as predicted at solarham.com but, again as luck would have it, the presence of lightning forced me to secure my station at that time.

Here's how I visualize the storm as depicted in Figure 1.  After the particles slammed into Earth around the Auroral Zone an ionospheric wave spread out at a surprisingly slow speed.  This wave is indicated by the exponentially decaying sine nature of the frequency variations.  The splitting of the frequency into 4 components is also surprising and could imply either a stacked vertical layering or possibly skip points spread out horizontally...but why 4?  In conclusion, I find both the layering and the slow speed with which the disturbance spread to be remarkable.

de w4hbk


Tuesday, July 10, 2012

Comparison of Two Solar Flares as Observed on QRSS Signals

The past two days there were M-Class Solar Flares the effects of which were observed on the Pensacola  QRSS grabber.  I present the data here just to document the effect as a starting point for further obversations.

The first two pictures are the grabber images and the last two the measured x-ray flux.

Figure 1.  08JUL12 Solar Flare on 30m

Figure 2.  09JUL12 Solar Flare on 20m
Figure 3.  08JUL12 X-Ray Flux Observed by GOES Satellites

Figure 4.  09JUL12 X-Ray Flux Observed by GOES Satellites

In the first event there was a rapid dropout of signal called a Sudden Ionospheric Disturbance (SID) but no noticable frequency shift.  The SID lasted about 20 minutes.  The X-Ray flux was 7x10^-5 W/m^2 and the Sun was almost directly over the skip point.  The transmitting stations were to the east of me at distances of about 300 miles/482 km.

In the second event there was only a modest drop in signal strength but a noticible upward shift in frequency indicating an upward movement of the reflecting layer.  As the signal began to recover there was a noticable broadening of the frequency with a return to normalcy after about 30 minutes.  The X-ray flux was 1x10^-5 W/m^2 or about 7 times weaker than the first event.  The Sun was low in the sky to the west relative to the skip point.  The transmitting station was 1164 miles/1872 km to the west of me.

It makes sense that the difference in the x-ray flux caused the difference in observed effect but at this point I just want to save the observations and numbers in a safe place for comparison to, hopefully, future observations.  We've seen these effects in the past but I haven't written down any numbers.

de w4hbk


Wednesday, July 4, 2012

NU7Z DDS MEPT

Here is another DDS-based MEPT for QRSS work which produces ~ 1W output on 160 thru 20m and with a different amp will go on up to 10m.  Hopefully it will provide some ideas.

Rick, NU7Z, built a MEPT similar to mine which is also based on the N3ZI DDS2 vfo.  He even used the all-band LPF from a defunct Kenwood xcvr which saves a lot of work, as well as the 5W amp kit from W8DIZ.  Even so there is much to be done to get a finished rig.

The output of the DDS2 is quite low, ~0.25V p-p into 1000 Ohm load, so needs a buffer amp to bring it up to 2.5 p-p V into a 50 Ohm load to drive an amplifier such as this one from W8DIZ.

Here is a picture of the guts of Rick's mept:


Here is the front panel:


You can look at my version from an earlier post here.  The main differece between mine and his is that I use the program QRS to key the fsk pin of the DDS2 via the computer's RS232 port and Rick uses an onboard keyer....I'm sure the one in the QRP Labs Mept's will work FB.

I should point out another source of MEPT circuits and rigs which have been developed by Dave, WA5DJJ, out in New Mexico.  His designs go from the Model 1 crystal tx, which I copied for my first mept, up thru his all-band DDS based rig which he uses today on all bands.

One thing for sure...once you have a DDS rig working you never have to search for crystals again.

Thursday, June 14, 2012

Archiving QRSS Uploads with Dropbox

One of the more difficult parts of operating a grabber is making an online archive and keeping it purged of old files.  I like to keep 24 hours of grabs which should give everybody time to look for their signal while they were asleep or whatever.

Until recently I had been using Picasa for archiving my grabber files using the feature which uploads images from my SL folder to Picasa Web and keeps the two synced.  As files in the SL folder get automatically deleted by a program called Autodelete when they are over 24 hours old the sync feature deletes the same files in the Picasa Web folder.  As Google made changes to Picasa the syncing process stopped working  requiring me to delete old files manually every day....ugh!  So now I use Dropbox.

I've seen Dropbox mentioned favorably as a place to store images and files for others to view so decided to check it out.  They offer a free account of 2 GB which is much more than adequate for my QRSS archiving. The files at Dropbox are maintained in sync with the corresponding folder on your computer. After establishing an account I linked it to my SL folder and then changed the URL link in my html file at qsl.net to that of the Dropbox folder...easy as pie and works like a charm.  I also like the images better and the ease of scanning through them.  The syncing is spot on.

The Dropbox account provides two folders, one for images and one for files.  Within the image folder you can add other folders and I use two, one for the 10 minute grabs and one for the 6 hour grabs.  The other folder for files has come in handy also as a way to include files with the posts in this blog ...Google doesn't allow files attachment in their blogs.

Autodelete is a neat little program that deletes computer files older than x days in specified folders when run, where x is 1 day or greater.  I run it 4 times a day automatically via the Windows Task Scheduler.  If you haven't used TS it is in Assesories/System Tools menu.

For a week now the Dropbox/Autodelete process has been performing flawlessly leaving me with one more thing I don't have to forget to do.

A special thanks to Dave, N4FRE, for watching the archives for problems, of which there were a few.

de w4hbk

Monday, June 4, 2012

A Spectrum Lab Tutorial for QRSS

Spectrum Lab is a creation of Wolf, DL4YHF.  I can say that having delt with spectrum analysis professionally during my career as a physicist that SL is a magnificent tool.  Not only does it do a nearly perfect job of rendering the waterfall spectrum but it includes an interactive programming capability which allows the user to expand the waterfall capabilities manyfold.

Lately several guys have asked for my Spectrum Lab .usr settings to help in starting to use SL.  It is the King of the grabber programs but at a price...the learning curve is very steep.  This is due to the many features, so many that it's hard to figure out which ones you need for grabber work except by lengthy experimentation.  I've been using SL for about 10 years and still find things I didn't know plus many I do know about but haven't had time to learn to use yet.

To get you started here are the .usr files for both the 10 minute and 6 Hour grabbers, plus comments on how to change the relevant settings to customize SL for your way.  Place these files in the "Configurations" folder and note their names carefully since this folder comes with many other .usr files.

After you run SL for the first time click on the "Quick Settings" tab at the top then "Load & Create User def'd entries...".  Increment to Menu Nr 1  then click on "Import", find the .usr file, open it and click on  Done.

Next:
1.  Click on Start/Stop at the top and then "Start Sound Thread"
2.  Click on "Options" then "Audio I/O" and select your sound card then the "CTRL" button to set the level so that the the noise is at the bottom of the amplitude scale on the right.

At this point your SL should work just like mine.  Once everything seems to be working it's a good idea to save this configuration in the "Quick Settings" window with a slightly diff name to distinguish it from the .usr file I provided so you can come back to it in the event things get all screwed up from experimenting.

The only other things relevant to a grabber are:

1. Options:  FFT, Audio I/O and Spectrum Display Settings Parts 1 and 2.
2. View/Windows: Controls on Left Side
------------------------------------------------------------------------------------------------
SL FFT Screen

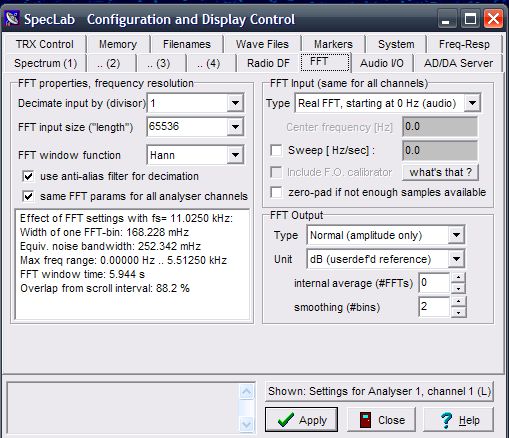
Proper use of the FFT screen requires some knowledge of FFT which can be pretty complicated.  The FFT Input Size essentially determines the spectral resolution and I've found that 65536 is the max usable for a 10 minute QRSS screen.  If you try a higher number for greater resolution it will be necessary to slow the scan rate down or else the image will become blurry due to longer response time.  If you want to use the other stuff in a meaningful way you'll just have to bite the bullet and read up on the Fast Fourier Transform.
------------------------------------------------------------------------------------------------


On the Audio I/O screen the only other things to adjust are the sample rate and it's calibration.  It is interactive with the FFT sample size and the optimum I've found is 11025.  Again, you need to know FFT theory to do it in a meaningful way.  Your sound card rate will differ from the 11025 and cause an error in the frequency scale on the display.  This can be corrected by measuring the apparent frequency of a known frequency and entering the data into the Sample Rate Calibrator.  I use the audio signal from WWV which is available for 500 and 600 Hz.

------------------------------------------------------------------------------------------------

On the Spectrum Display, Part 1 the main adjustment is the Waterfall Scroll Interval.  700 mSec is just right for a 10 minute grabber with amplitude graph and 20000 for my 6 hour grabber without amplitude graph.  I've found no reason to make a screen width "exact" in terms of the desired time coverage.  For example, having a 10 minute grabber go a minute or so longer works just fine even for stacking purposes.  Of the little boxes to check only Vertical Freq Axis, optimum waterfall avg, Amplitude Grid and Waterfall Time Grid Enabled seem to be important.  In the Show window you can select whether and where to have the amplitude grid and below that how wide to make the amplitude window.  The other parameters in Waterfall Time Grid allow choice of the time ticks along the bottom.

------------------------------------------------------------------------------------------------


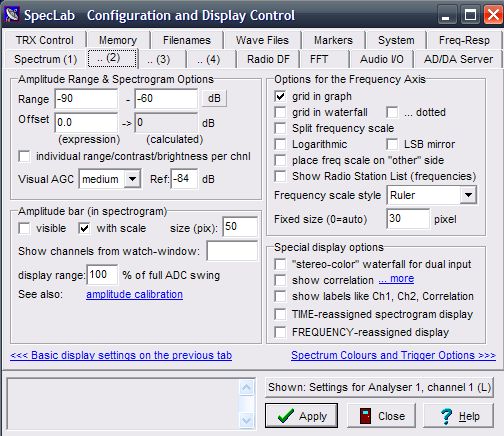
On the Spectrum Display, Part 2 the main adjustment is the range, which interacts with the signal level into the sound card.  I find that a range from -90 to -30 dB is a good starting point and that the signal level should be adjusted to make the noise level at about -90 dB.  The Visual AGC is an interesting function and helps keep the display at a constant level.  The selections are off, slow, medium and fast plus a reference level.  If it's off you may find it necessary to adjust the rx audio or sound card level often.  The ref should be close to the low end of the range or about -84 dB when the lower end is -90.  Selecting "fast" suppresses most impulse noise like lightning and slow or medium shows such noise.  Sometimes it's good to see lightning or other clicks and pops from local switch gear but I've found that for stacking it's best to eliminate it since it accumulates in the stacked image.  Whatever the choice, it's mainly an appearance thing and doesn't actually improve the SNR, etc.  As for the other choices, I always select Grid in Graph to help in reading signal levels and occasionally Grid in Waterfall (dotted) to help in reading frequencies in the waterfall.  Finally, use the Frequency Scale Style to select either Classic (more detailed and larger) or Ruler (less cluttered and smaller) along with the Pixel Size to select it's size.

-------------------------------------------------------------------------------------------------


Finally, on the "Controls on Left" under View/Windows you will find the adjustments for total spectral range and the colors, intensity and contrast of the display.  For an offset of 0 enter the desired audio frequency range (min & max).  I use 1300 Hz as the center of the QRSS band in question and go 100 Hz above and below this.  Thus the Min and Max frequencies are 1200 and 1400 Hz, respectively. For example, with my TS-440 in USB mode and dial frequency of 10138.700 a signal at 10140.000 will produce an audio tone of 1300 Hz. That is, 10140.000 - 10138.700 = 1300 Hz.  Enter the dial frequency (Hz) in the Offset window to make the frequency scale read in absolute units of Hz.  To get the screen looking just the way you want it select a color scheme by left-clicking on the color palette then move the B slider to adjust Brightness and the C slider to adjust Contrast.

There you go.  I've mentioned everything I've found important and I think you can ignore all the rest.  Even so, when I look at how much I've just typed that's still a lot.  But KEEP IN MIND you should be able to use the .usr files I sent without needing to advance all the way up the learning curve and/or learn it as you feel necessary or have time.  Don't forget to read the Spectrum Help file for more detailed help.

de w4hbk


Uploading Files Using DOS Commands

                             
Several months ago I found a somewhat hidden feature in Spectrum Lab which uses DOS commands in a simple batch file to directly upload grabs. I learned to use DOS commands and batch files years ago before there was Windows and the Internet so that's probably why I wasn't aware of the ftp DOS commands.  I haven't seen anyone describe it for QRSS grabbers so I'll report my experiences with it.

The programming consists of a few lines of code within SL and a few lines in a special file in the root directory,C:\.  Once it's working there's no need for a separate program such as Argo Uploader and it starts working as soon as SL is switched on.

Here's the two lines that go in the Periodic Actions page in SL:
-------------------------------------------
capture("C:\\ftp_upload\\SL1.jpg")
exec ("c:\\ftp_upload\\ftp_up.bat SL1.jpg")
-------------------------------------------
The first line makes the grab and stores it in the special folder in the root directory and the second line causes the batch file with the upload instructions to be executed and upload the file to my page at qsl.net.

The batch file and associated files are located in the folder c:\ftp_upload which contains the following files:

ftp_up.bat
ftpcmd.txt
ftplog.txt
SL1.jpg

Here's what the batch file, ftp_up.bat, looks like:
----------------------------------------
cd \ftp_upload

>> ftpcmd.txt echo USER user password

>> ftpcmd.txt echo binary

>> ftpcmd.txt echo put SL1.jpg

>> ftpcmd.txt echo disconnect

>> ftpcmd.txt ECHO bye

FTP  -n -s:ftpcmd.txt ftp.qsl.net > ftplog.txt

End
---------------------------------------

The files ftpcmd.txt and ftplog.txt are generated the first time the batch file runs so you don't have to worry about their content. SL1.jpg is the name of the grabbed image file that is expected by my page at qsl.net.  For the longer grabber it's 4Hr.jpg.

The first line in ftp_up.bat ensures we're in the directory with the file to be uploaded.  The other lines are standard DOS commands and the only thing you need to change is user and password in the next line and the ftp address of you web page in the next to last line.  Note that the USER in caps is part of the DOS ftp command and user is your username at your web site.  Otherwise it's not necessary to understand DOS command programming (which I barely do).

I actually have three versions of the batch uploader, one for each of my two grabbers and one to upload an "Off the Air" screen.  I simply name them ftp_upload1, 2 and 3. It's very versatile.

The only drawback to this method of uploading is that a small black cmd: screen pops up for a few seconds while it's uploading. If you find it annoying there's a way to suppress this screen but I'll save that procedure for a ps below.

Here is my Periodic Action Screen in Spectrum Lab:

Spectrum Lab Periodic Action Screen
The first line captures the screen for my storage folder and gives it a name like "SL04JUN12 1410z".
The second line captures it again with the name "SL1" just for upload purposes.
The third line executes the upload batch file.

DOS commands and batch files can be pretty tricky because of all the parameters and switches so if you have trouble I'll be glad to help.

de w4hbk

ps  How to suppress the black pop-up cmd: screen.

There is a Properties Box associated with the cmd: screen which can be invoked by right clicking on the bar at the top of the cmd: screen.  Since it stays on for only a few seconds it will be necessary to hit the "Pause" key to make it freeze so you have time to work, then "any key" to resume.  This doesn't actually suppress it but it reduces the size and moves it to a corner.  Change "Window Size" to 1 for both width and height and "Window Position" to move it to a corner.  As you change the numbers you'll see the changes in the "Window Preview".  It can actually be moved completely off screen by making one of the position numbers larger than the screen but I left mine as a tiny screen at the lower left so I'll be aware something is happening.  Maybe as I get more confident I'll move it totally off.